
Business Problem: Improving Customer Satisfaction through Sentiment Analysis
For the this hotel, understanding customer sentiments from reviews can help identify strengths and areas for improvement. By applying machine learning techniques, such as natural language processing (NLP) we extracted valuable insights from positive and negative reviews, helping the hotel management to enhance customer satisfaction and address common issues.
Dataset
This dataset contained 2,500 customer reviews for an hotel on the Sunshine coat Australia. The hotel opened exactly one year before the data was scraped, and these reviews provide valuable insight into the experiences of guests who stayed at the property during its first year of operation.
The dataset consists of customer reviews, including positive and negative feedback, along with ratings, guest information, and visit details.
Sentiment Analysis
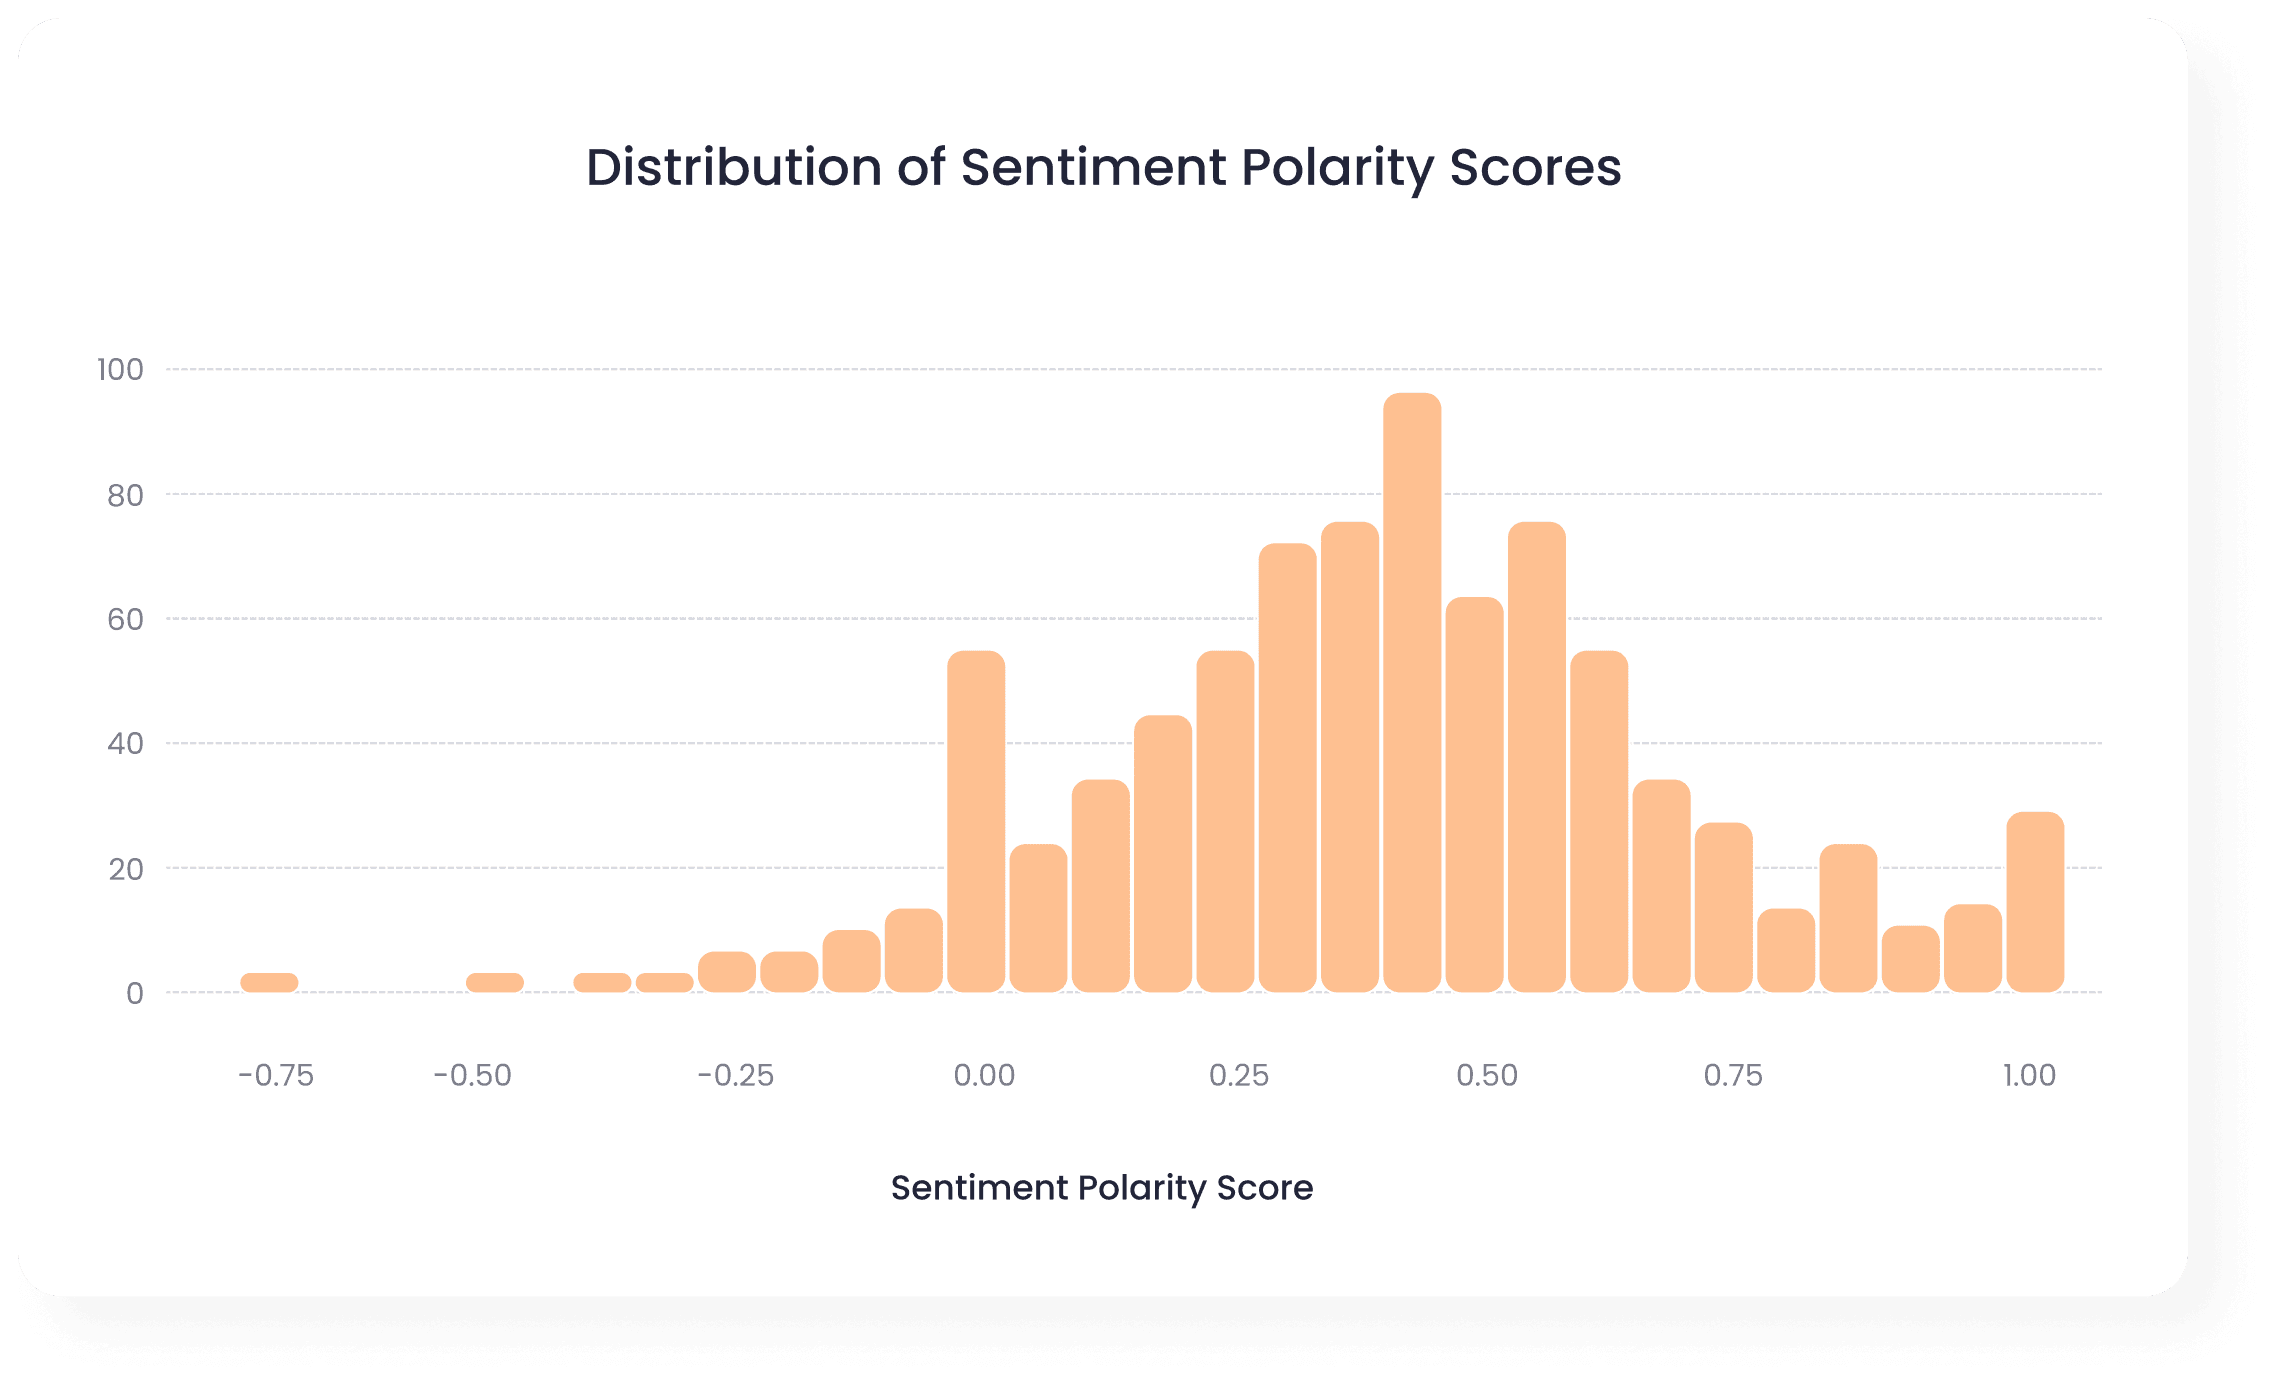
We used TextBlob for sentiment analysis, which categorises reviews as positive, negative, or neutral based on the sentiment polarity score.
The histogram shows the distribution of sentiment polarity scores. Most of the scores are positive, with fewer negative scores and some neutral ones.
Word Cloud for Positive and Negative Reviews
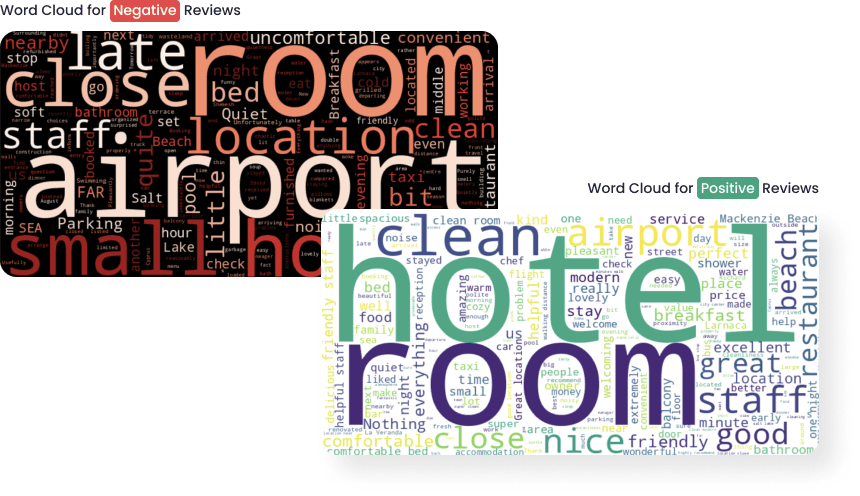
The word clouds provide a visual representation of the most frequent words in positive and negative reviews:
Positive Reviews: Common words include "great", "clean", "staff", "comfortable", and "good".
Negative Reviews: Frequent words include "nothing", "small", "no", "issue", and "uncomfortable".
Common Bigrams in Negative Reviews
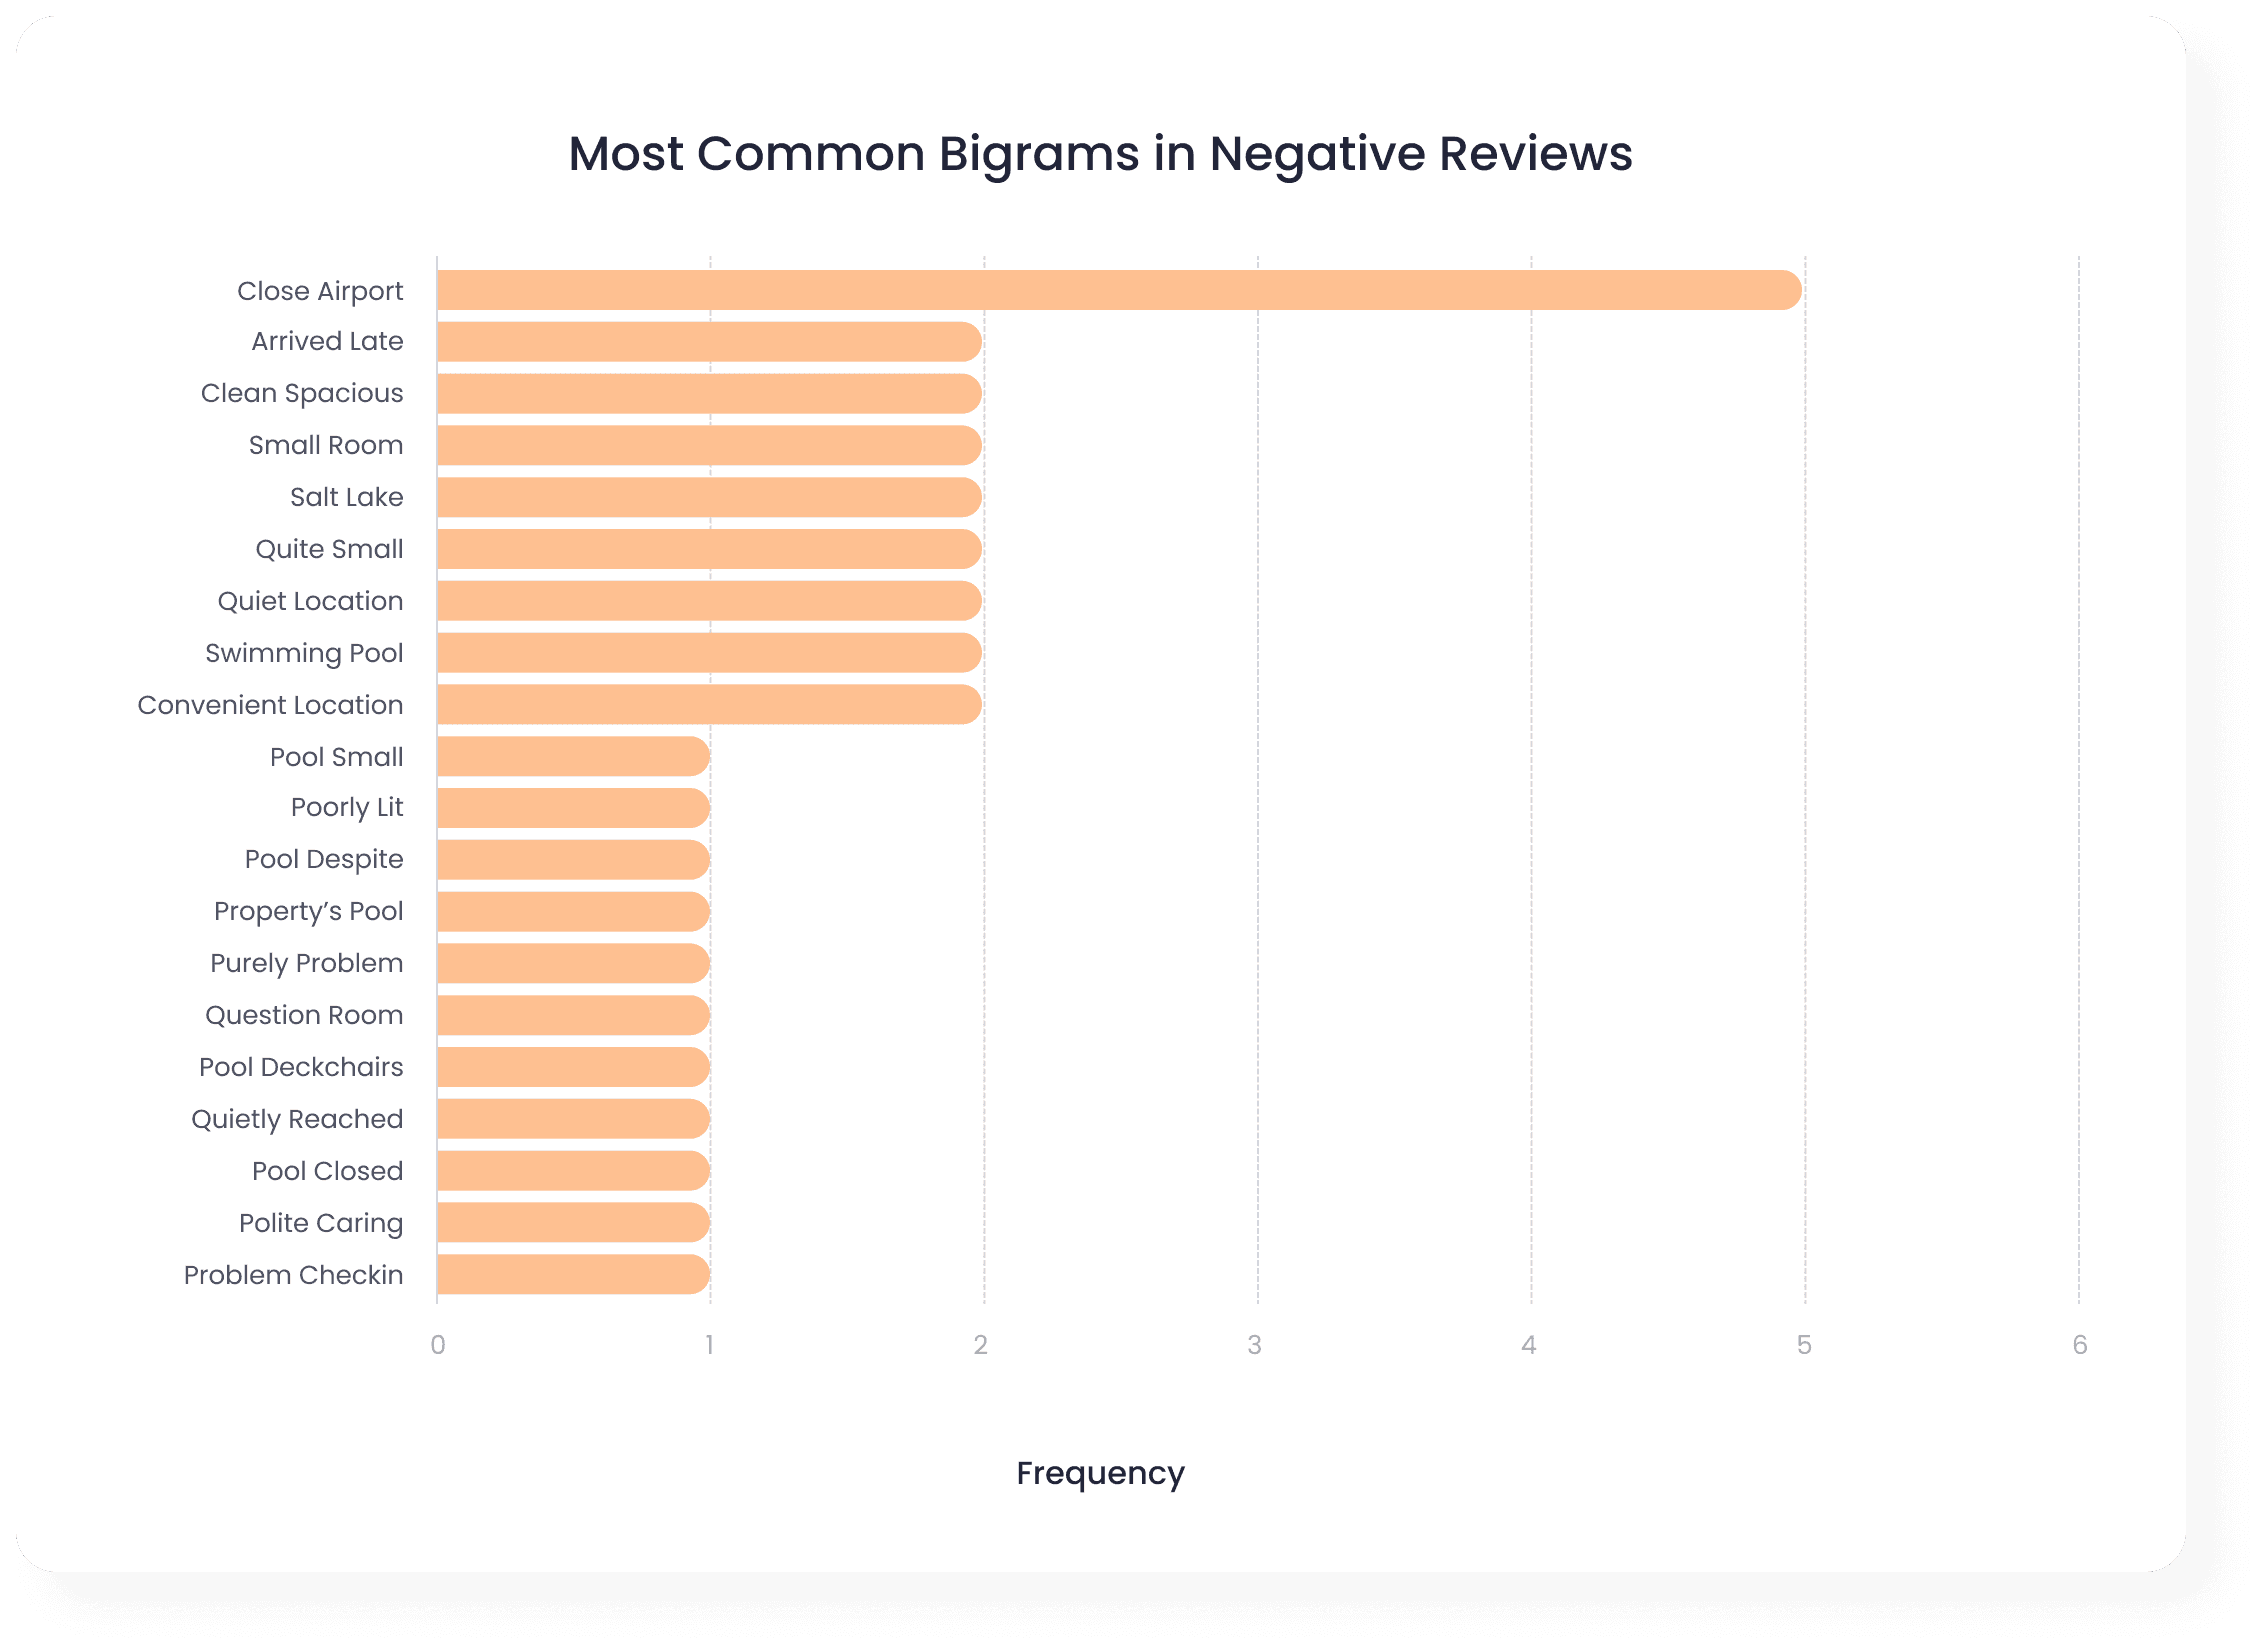
The bar chart shows the most common two-word combinations (bigrams) in negative reviews. Frequent bigrams such as "small room", "late check", "noise airport", and "poor service" provide specific insights into common complaints.
Seasonal negative review trends
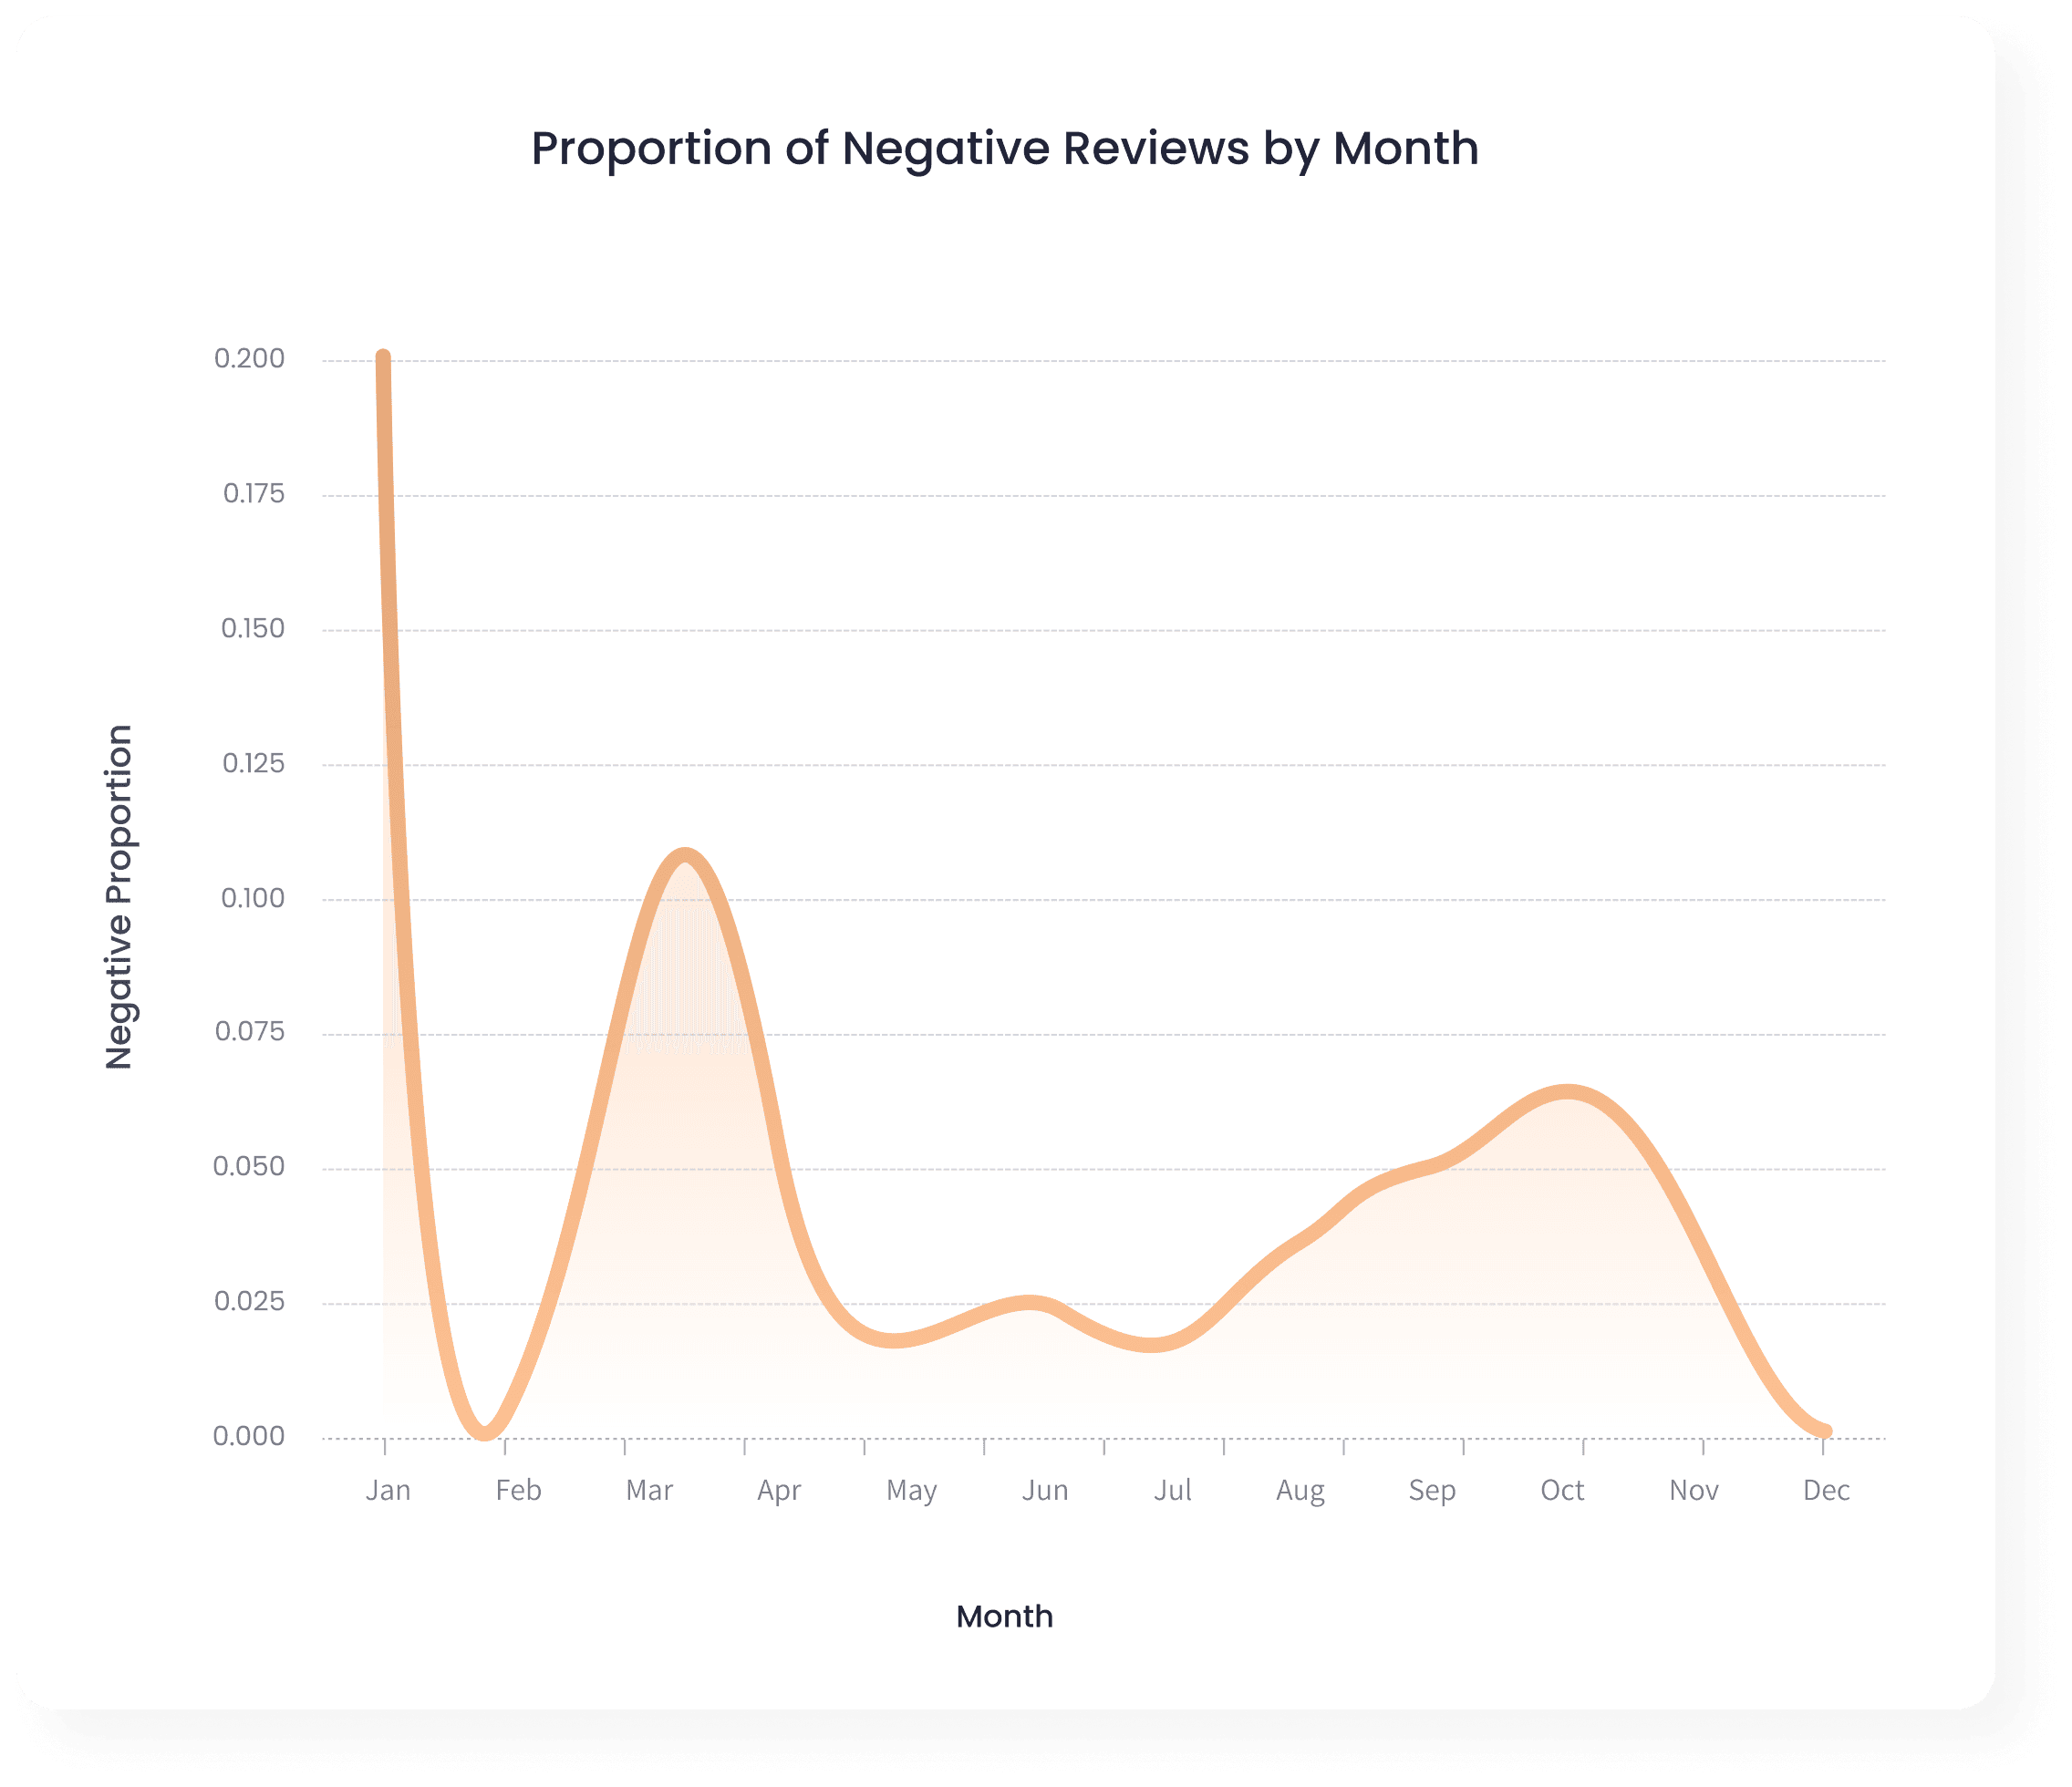
The chart highlights the proportion of negative reviews each month, showing how dissatisfaction varies throughout the year.
The proportion of negative reviews varies throughout the year, with January having the highest proportion and February the lowest. The average proportion of negative reviews is 4.97%, with some month-to-month variations indicating fluctuations in guest dissatisfaction.
Why?
Teething Problems: Early operational adjustments in January could result in higher dissatisfaction.
Holiday Season: High traveler volume in January might strain services, revealing weaknesses.
Fewer Visitors: Lower traveler volume in February allows for personalized attention, reducing dissatisfaction.
High Expectations: New hotel guests may have had high expectations, leading to harsher reviews if unmet.
Recommendations
Address Negative Feedback: Focus on addressing the specific issues mentioned in negative reviews, such as room size or discomfort.
Leverage Positive Aspects: Highlight the positive aspects like cleanliness and staff friendliness in marketing efforts.
Monitor Neutral Feedback: Pay attention to neutral feedback for subtle hints on improving services that might not be overtly negative but still affect overall guest satisfaction.